Fire Weather, by John Vaillant
I picked up Fire Weather as a Californian coming to grips with the increasing severity of fires over the last decade. John Vaillant presents the devastating 2016 Fort McMurray’s fire as one example of the spate of increasingly common record-breaking fires to support his thesis: increasing temperatures have ignited a new breed of fire. These new fires burn hotter, longer, and are unlike any that we’ve previously dealt with.
In writing this post I wanted to look at some basic data underlying Vaillant’s thesis, that incendiary environmental conditions have given rise to a new generation of fire. His narrative compelling, but I was curious to see whether it followed the trendlines and what further questions sparked. Vaillant’s reportage ranges over far more ground than I’ve covered here, but I’ve sliced off a few basic questions with available data.
This isn’t a scientific analysis, just my own exploration of some data.
Temperatures and dryness are increasing [in California]
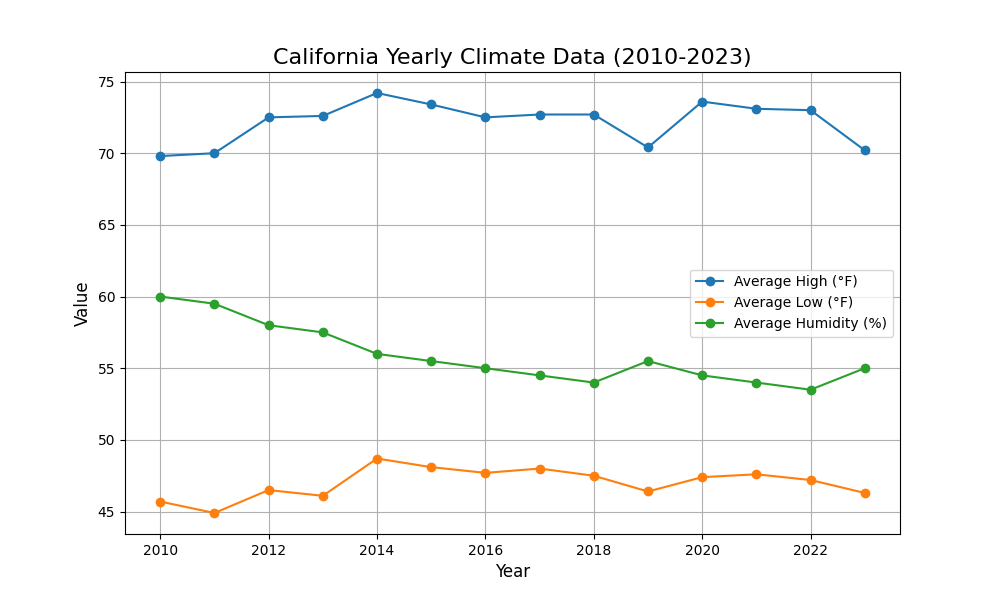
I took a look at the yearly temperature and humidity averages across California from 2010 on to get an idea of the overall trends. Disclaimer: Given the large geographic area and long time period we’re averaging across, much of the detail is blurred out. In exchange, we get a quick birds eye view of the data.
While the average high and low temperatures are fairly consistent over time, the average humidity has trended downwards from 60% in 2010 at around half a percent per year. This greater than 5% drop represents a significant change in the average humidity.
Low humidity is a major driver of fire risk. One of the primary red flag criteria is “Relative humidity of 15% or less combined with sustained surface winds, or frequent gusts, of 25 mph or greater. Both conditions must occur simultaneously for at least 3 hours in a 12 hour period.” (NWS - Fire Criteria). While the yearly data shows humidity decreasing on average, it’s too coarse to understand how often humidity dropped below this 15% threshold. I’m curious to see the data on how often red flag warnings were issued to see if those are trending upwards.
To loop back to average temperature: while this data didn’t show significant trends in California the global average surface temperature has increased “2.12 °F (1.18 °C) above the 20th-century average of 57.0°F (13.9°C)”. (Climate.gov - Global Temperature)

Fires are becoming increasingly common and severe
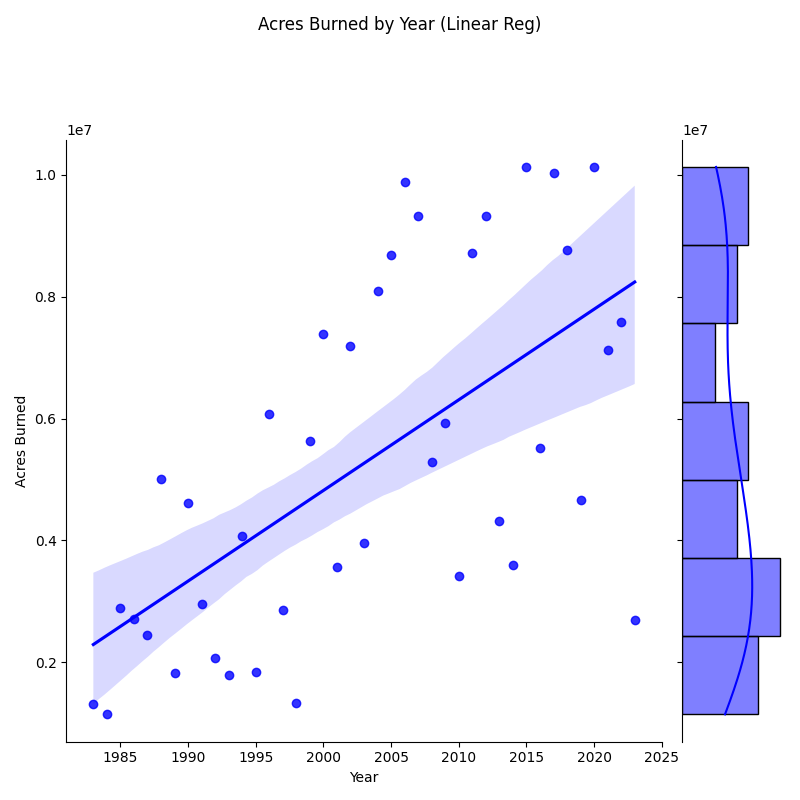
US federal data showing acres burned nationally by year bears out increasing fire severity. A quick and dirty linear regression of the data showing an increase of ~ 150,000 acres burned yearly (R-squared is 0.38 and correlation coefficient is 0.61).

- https://www.pnas.org/doi/10.1073/pnas.2213815120
- https://www.nifc.gov/fire-information/statistics/wildfires
Correlation between fires and temperature / dryness
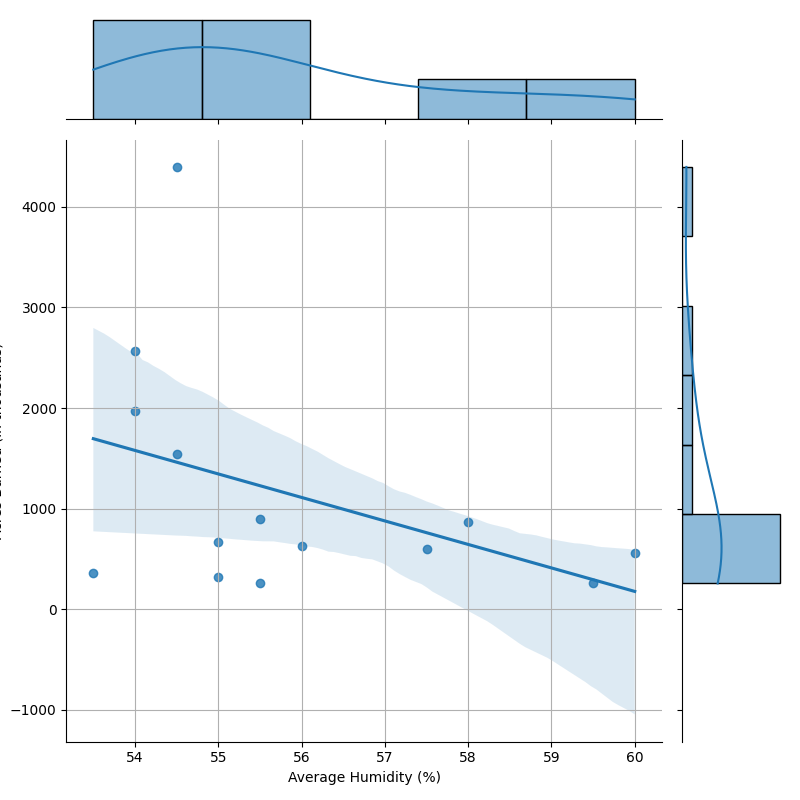
It’s a likely assumption that as conditions get drier, fires get worse. I compared the yearly average humidity and acres burned on a scatter plot.
Although the scatterplot seems to depict some sort of correlation between average humidity and acres burned in California since 2010, the Pearson correlation’s p-value is 0.140. So, not necessarily statistically significant. And, recall that average humidity is likely not as indicative as, say, the number of days below 15% humidity throughout.

2023 as a US outlier in acres burned
2023 stuck out to me as a not-as-burned outlier in the US, more comparable with 1998 rather than the incendiary recent years. While I pulled in some context and possible causes out of curiosity, this outlier is likely within normal variance so take it with a grain of salt.
The 2023 NICC Wildland Fire Summary and Statistics Report gives a qualitative description, saying “much of the West was characterized with above normal precipitation and below normal temperatures January through March.” Per normal, fire activity stepped up through the summer months until “Significant fire activity generally decreased during September as the national PL dropped from four to three September 7 and from three to two September 26”. 2023 saw a slight increase in humidity, bucking the downward trend.
The US’s mild year might just be an outlier: in 2023, Canada experienced 15.2M acres burned, more than twice the total of its previously worst year. Europe also had a particularly bad year for wildfires, as reported by the EU. 2023 was also “the warmest year since global records began in 1850 by a wide margin.” (Climate.gov - Global Temperature)
Aside: Visualizing Fort McMurray
To visualize the Fort McMurray surrounds I swiped through some Google Maps. It can’t truly put the scale of the mines into perspective, but it is a start: